How to profile C++ application with Callgrind / KCacheGrind
I have shown before how to profile a C++ application using the Linux perf tools. In this post, we will see how to profile the same kind of application using Callgrind. Callgrind is a tool in part of the Valgrind toolchain. It is running in Valgrind framework. The principle is not the same. When you use Callgrind to profile an application, your application is transformed in an intermediate language and then ran in a virtual processor emulated by valgrind. This has a huge run-time overhead, but the precision is really good and your profiling data is complete. An application running in Callgrind can be 10 to 50 times slower than normally.
The output of Callgrind is flat cal graph that is not really usable directly. In this post, we will use KCachegrind to display the informations about the profiling of the analyzed application.
Installation
First of all, you need to install Callgrind and KCachegrind. You also need to install graphviz in order to view the call graph in KCachegrind. The applications are already packaged for the most important Linux distributions. You can just use apt-get to install them:
sudo apt-get install valgrind kcachegrind graphviz
or aptitude:
sudo aptitude install valgrind kcachegrind graphviz
or whatever your favourite package manager is.
Usage
We have to start by profiling the application with Callgrind. To profile an application with Callgrind, you just have to prepend the Callgrind invocation in front of your normal program invocation:
valgrind --tool=callgrind program [program_options]
The result will be stored in a callgrind.out.XXX file where XXX will be the process identifier.
You can read this file using a text editor, but it won't be very useful because it's very cryptic. That's here that KCacheGrind will be useful. You can launch KCacheGrind using command line or in the program menu if your system installed it here. Then, you have to open your profile file.
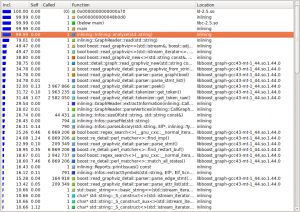
The first view present a list of all the profiled functions. You can see the inclusive and the self cost of each function and the location of each one.
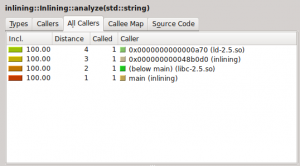
Once you click on a function, the other views are filled with information. The view in uppper right part of the window gives some information about the selected function.
The view have several tabs presenting different information:
- Types : Present the types of events that have been recorded. In our case, it's not really interesting, it's just the number of instructions fetch
- Callers : List of the direct callers
- All Callers : List of all the callers, it seems the callers and the callers of the callers
- Callee Map : A map of the callee, personally, I do not really understand this view, but it's a kind of call graph representing the cost of the functions
- Source code : The source code of the function if the application has been compiled with the debug symbol
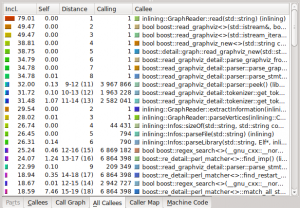
And finally, you have another view with data about the selected function.
Again, several tabs:
- Callees : The direct callees of the function
- Call Graph : The call graph from the function to the end
- All Callees : All the callees and the callees of the callees
- Caller Map : The map of the caller, again not really understandable for me
- Machine Code : The machine code of the function if the application has been profiled with --dump-instr=yes option
You have also several display options and filter features to find exactly what you want and display it the way you want.
The information provided by KCacheGrind can be very useful to find which functions takes too much time or which functions are called too much.
I hope this article will be useful.


Comments
Comments powered by Disqus