Generate graphs benchmarks easily
After launching a lot of benchmarks for file copy benchmark and always generating the graphs from the results in Excel, I realized that I was loosing a lot of time to do that. So like any Java developer, I decided to create a little tool that do the work automatically for me.
For creating benchmarks, I'm using a little micro-benchmarking framework, described here. After the results are generated, I automatically generate a bar chart of the result using JFreeChart.
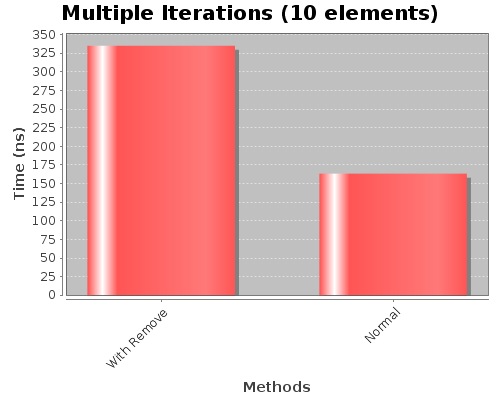
Here is an example of graph generated by the tool :
Usage of the library
The usage is quite simple. By example, if you want to benchmark two methods :
public void method1(){
    //Code...
}

public void method2(){
    //Code...
}
Start creating a Benchs :
Benchs benchs = new Benchs("Title of the benchmark");

benchs.setFolder("folder_path");
folder_path indicates the folder were the graphs will be generated.
And let’s start the benchs :
benchs.bench("First method", new Runnable(){
    public void run() {
        method1();
    }
});

benchs.bench("Second method", new Runnable(){
    public void run() {
        method2();
    }
});

benchs.generateCharts();
The charts will be generated in the specified folder.
Sub chart
If in the first graph, there is some methods that takes a lot more time than the others methods, a sub chart will be generated including only the best methods. The methods to be removed from the graph to create the sub graph are selected using an exclusion factor. All the benchmarks with a mean exclusionFactor times higher than an other benchmark mean will be excluded. You can configure the exclusion factor using the setExclusionFactor setter. The default is 50.
You can donwload it here : benchmark-utils.tar.gz
You can consult the GitHub website for more informations and to get the sources.

Comments
Comments powered by Disqus