Discover Java VisualVM 1.3
2 days ago, Java VisualVM 1.3 has been released. We'll see what's new with this release.
At this time, there is no package for Ubuntu, so we'll install it manually :
wget https://visualvm.dev.java.net/files/documents/7163/151728/visualvm_13.zip
unzip visualvm_13.zip
And then we can directly launch it :
cd visualvm_13/bin
sh visualvm
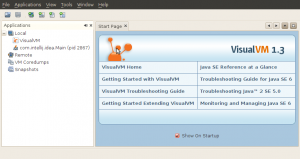
You'll be asked for the license agreement and after that the tool is launched :
Here there is nothing new, except for the change of version of course. So let's profile something. In my case, I profile IntelliJ Idea for the test, but this doesn't change anything. We immediately see that there is a new tab (Sampler). If we watch the three first tabs (Overview, Monitor and Threads), we see that there is no changes.
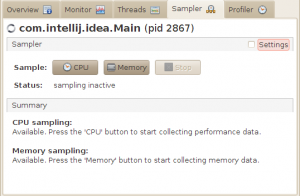
The Sampler tab is simply a plugin (VisualVM Sampler Plugin) that has been integrated by default in VisualVM. Sampling is not like profiling. There is no instrumentation, so no setup time and almost no overhead, the application run at full speed. This is achieved by periodically polling the monitored application for thread dumps or memory histograms. So let's test to the Sampler tab :
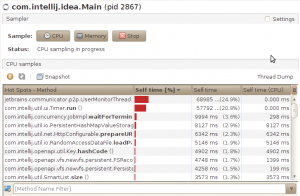
Like, int the Profiler tab, we can launch CPU or Memory sampling. So let's try CPU :
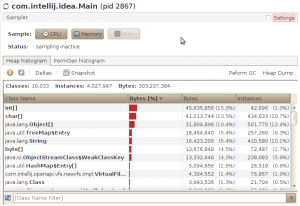
You will immediately see the speed of the results, there is no time to wait, but the refreshes are slower of course, because, it's periodic. The results are like in the Profiler tab. If we start Memory Sampling :
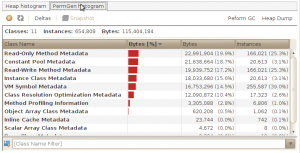
Once again, the results are the same as with the Profiler, but we see a new feature, the PermGen histogram :
That could be really useful to see why your application takes a lot of PermGen space or simply to see that there is not enough PermGen space.
There is another new feature in this version. The Tracer Probes. But by default, there is no installed probes, so you must install plugins to see them :
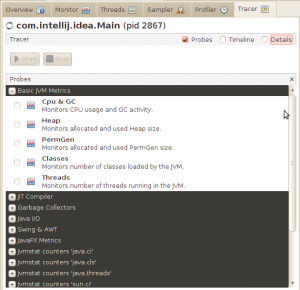
Then, just click install, accept the license agreement and let the application restart. And then, if you launch the profiling of an application, you'll see the Tracer tab :
You see that there is a lot of probes that we can enable. So let's enable some probes and Start the Tracer :
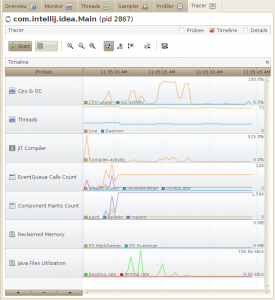
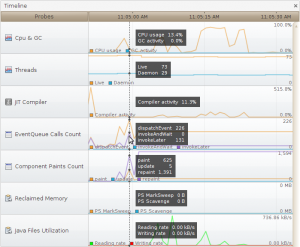
Like the profiler, there is a needed time of instrumentation and after that, you will see some graphs. There is a graph for each probe you selected. Each probe display some specific data, by example, the Threads Probe display the number of threads and the number of Deamon threads and the JIT Compiler Probe display the activity of the JIT compiler. Here I've also enabled some Swing probes because IntelliJ Idea use Swing, but you have also Probes for JavaFX by example. If you pass the mouse on the graphs, you will see the exact values at the time where the cursor is :
It's think this new Tracer is just awesome. It's really useful and really good-looking.
So we've now covered the main new features of this new version. I think this version adds some great new features and improvements and that will make of VisualVM an essential profiler.
For the complete information about this new version, read the release notes.

Comments
Comments powered by Disqus